‘The Shriver Report Snapshot: Insight Into Intellectual Disabilities in the 21st Century’ — Full Findings

Harris Poll conducted the survey online within the United States on behalf of The Special Olympic International World Games in partnership with Shriver Media from July 13 to July 15, 2015 among a total of 2,021 U.S. adults ages 18+, of whom 1,103 were identified as knowing someone with an intellectual disability. Figures for age, sex, education, region and ethnicity were weighted where necessary to bring them into line with their actual proportions in the population. The data were weighted to reflect the composition of the general adult population. Propensity score weighting was used to adjust for respondents’ propensity to be online.
All sample surveys and polls, whether or not they use probability sampling, are subject to multiple sources of error which are most often not possible to quantify or estimate, including sampling error, coverage error, error associated with nonresponse, error associated with question wording and response options, and post-survey weighting and adjustments. Therefore, Harris Poll avoids the words “margin of error” as they are misleading. All that can be calculated are different possible sampling errors with different probabilities for pure, unweighted, random samples with 100% response rates. These are only theoretical because no published polls come close to this ideal.
Respondents for this survey were selected from among those who have agreed to participate in Harris Poll surveys. Because the sample is based on those who agreed to be invited to participate in the Harris Poll online research panel, no estimates of theoretical sampling error can be calculated.
FAMILIARITY WITH INTELLECTUAL DISABILITIES
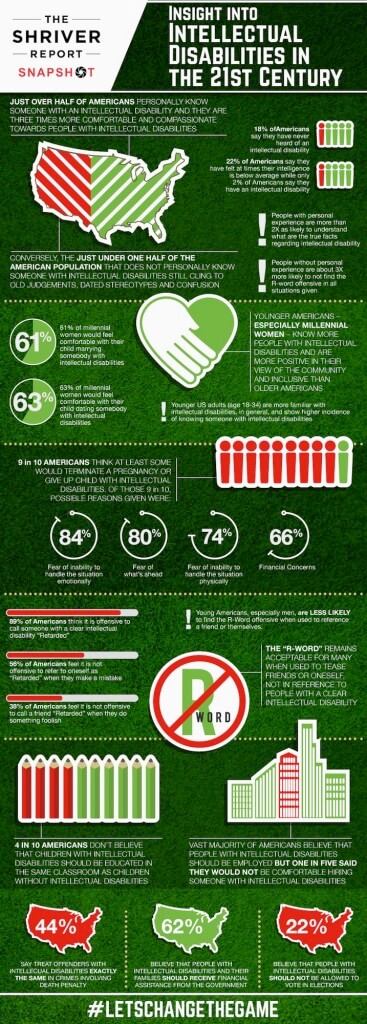
Lower than expected familiarity with those who have ID points to idea that many with ID still live in isolation. Positive sign seen in that Millennials are much more likely to know someone with ID; still lots of confusion around what it means.
When given the definition of Intellectual Disability…
-
- More than 2 in 5 adults (44%) say they are not familiar with ID (not familiar/never heard of it).
- One in five men (22%) say they have never heard of it. This is driven primarily by older males (18-34, 13%; 35-44, 25%; 45-54, 26%; 55-64, 24%; 65+, 28%).
- More than 2 in 5 adults (44%) say they are not familiar with ID (not familiar/never heard of it).
We asked US adults if they personally know someone with ID…
-
- About half of adults (56%) report knowing someone with ID.
- Nearly three-quarters of young women (age 18-34) (72%), and 3 in 5 young men (age 18-34) (61%) say they know someone with ID.
- Nearly one-quarter of adults (24%) say they have a family member with ID.
- Only 2% of adults say that they themselves have ID
- When unaided by a definition, more than one in five adults (22%) say they’ve felt like their intelligences is below average at times.”
- About half of adults (56%) report knowing someone with ID.


BELIEFS, PERCEPTIONS & MISPERCEPTIONS
Many US adults are uninformed about intellectual disabilities; knowing someone with ID proven to help immensely to clear confusion.
Adults were asked what they believed to be true about ID…
-
- Less than one-quarter adults (22%) believe that ID is a mental illness.
- Only 5% of adults believe that all people with ID have severe or violent emotional outbursts.
- Nearly 1 in 10 (8%) believe ID is just another name for Down syndrome.
- Nearly 1 in 10 (9%) think ID is just another name for autism.
- Six in ten adults (61%) think that people with ID develop and learn more slowly and differently than others.
- Only 7% think all people with ID remain child-like throughout their lives.
- More than 1 in 10 (13%) think people with ID do not act appropriately in social situations.
- 1 in 5 adults (20%) believe people with ID have below-average IQ.
- Only 7% think adults with ID lack the ability to take care of themselves.

COMFORT LEVEL
Majority of US adults do show compassion toward those with ID, but Millennial women have higher comfort level with the situations which may affect them more personally (their child).
Americans found to be comfortable when asked about their level of comfort with hypothetical situations…
-
- 4 in 5 adults (83%) say they would be comfortable working with someone with ID.
- 4 in 5 (80%) believe they would be comfortable employing someone with ID.
- 88% would be comfortable having a neighbor with ID who lives independently.
- Nearly 9 in 10 (89%) say they would be comfortable having their child be in the same classroom as a child with ID.
Millennial women do show higher comfort with having their child date/marry someone with ID.
-
- More than half of adults (55%) say they would be uncomfortable having their child marry someone with ID;
-
-
- This level of discomfort appears to increase with age (18-34, 41%; 35-44, 49%; 45-54, 58%; 55-64, 64%; 65+, 69%).
- We see the opposite of millennial women where 61% say they would be comfortable.
-
-
- Half of adults (50%) say they would be uncomfortable having their child date someone with ID;
-
-
- Nearly 3 in 5 of those age 55+ say they would feel uncomfortable with this hypothetical situation.
- Again, millennial women age 18-34 lead in compassion as more than 3 in 5 (63%) say they would be comfortable with this situation.
-


INTELLIGENCE & R-WORD
For many, the ‘r-word’ is still seen as acceptable to use when teasing others/selves, so long as it’s not pointed at those with ID.
When adults were asked which scenarios they found to be offensive…
-
- Adults overall (92%) are offended by the use of the word retard.
- Women are more likely than men to find the slur offensive (96% vs. 89%).
- Most adults say that calling someone with Down syndrome or autism a retard is offensive (89%), and using the term for a stranger when they do something foolish is also offensive (76%).
- However, as it relates to those more familiar, fewer adults say it is offensive if a friend is called retard for doing something foolish; just over half find it offensive (62%).
- Further, less than half say it is offensive if an inanimate object is called retarded (40%), or even pointing the slur at themselves (44%).
When asked about a person’s own intelligence…
-
- More than one in five adults (22%) say at times they’ve felt that their own intelligence is below average; this is higher among younger adults, and trends down with age (18-34, 27%; 35-44, 23%; 45-54, 23%; 55-64, 19%; 65+, 14%).


EDUCATION & CAPABILITIES
Again, adults’ compassion shines through when asked how strongly they agree or disagree with several scenarios around people with ID.
Most agree that those with ID deserve the chance to be educated and live the same way as others, while 1 in 10 think adults with intellectual disabilities should be institutionalized.
Agreement with statements about intellectual disability…
-
- 3 in 5 (61%) agree that school-age children with ID should be educated in the same classrooms as other kids their age.
- Nearly 1 in 10 (8%) agree that adults with ID should all be institutionalized.
- 9 in 10 (93%) agree that adults with ID should be encouraged to have jobs.
- Less than one-quarter (22%) agree that adults with ID should not be allowed to vote in elections.
- More than one-quarter (26%) agree that parents of children with ID should lower their expectations about their child’s potential for success.
- 84% agree that adults with ID should be encouraged to live independently.
- More than 3 in 5 (62%) agree that people with ID and their families should receive financial assistance from the federal government.
- More than 1 in 10 (13%) agree that a person with an ID should be denied an organ transplant if someone without an ID is also eligible.
- More than half (56%) agree that a person with an ID who commits a crime where the death penalty is a possible sentence should be treated differently than someone without an intellectual disability.

PREGNANCY
When adults were asked which proportion of the US population would not want to be involved with their child with ID, a large majority believe that at least some would not (91%); mostly driven by fear of the unknown (physical/emotional/financial).
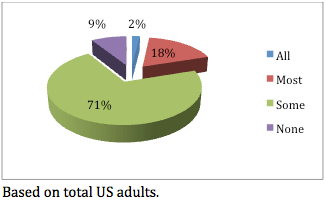
Adults were asked what proportion of US adults would terminate a pregnancy or give a child up for adoption if they found out that their child had an intellectual disability…
-
-
-
- 1 in 5 adults (20%) report that all or most US adults would not want to be involved with their child who has ID (terminate a pregnancy/give up the child for adoption).
- Less than 1 in 10 (9%) say that none would.
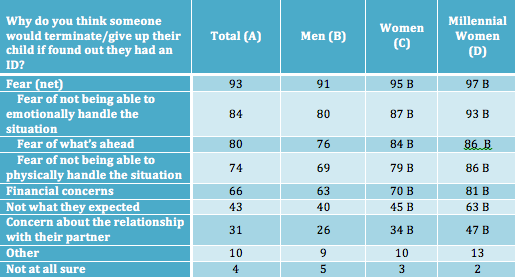
When asked why they think someone would give up/terminate their child with ID…
-
- Most adults who say ‘at least some would give up/terminate’ believe ‘Fear’ is the driver of termination/giving up children with ID for adoption (93%).
- 84% say fear of not being able to emotionally handle the situation; more than 9 in 10 young women age 18-34 (93%) indicate this.
- 4 in 5 (80%) say “fear of what’s ahead”.
- Nearly three-quarters (74%) say fear of not being able to physically handle the situation; nearly 9 in 10 young women age 18-34 (86%) indicate this.
- Two-thirds (66%) say “financial concerns”, driven by young adults 18-34 (75%) (perhaps because they are in their child bearing years).
- 43% say ‘not what they expected’.
- 3 in 10 (31%) say ‘because of concern about their relationship with their partner’.
- Nearly half of young women age 18-34 (47%) stated this.
- Most adults who say ‘at least some would give up/terminate’ believe ‘Fear’ is the driver of termination/giving up children with ID for adoption (93%).
Read the full press release and download the complete infographic displaying the major results:
More from The Shriver Report Project:
For a quick-read Shriver Report Snapshot on the 21st century man, click here. For in-depth reporting on the major issues facing American women today, read the book-length Special Editions of The Shriver Report Project here.
Tables and graphs by Harris Poll.
Infographic by JP Tanner/TanwoodCreative.com.
Photograph by Richard Corman for the Special Olympics.
- 1 in 5 adults (20%) report that all or most US adults would not want to be involved with their child who has ID (terminate a pregnancy/give up the child for adoption).
-
-